Strong jets tend to be steady, while weaker jets tend to fluctuate more in their north-south positioning. This relationship is found to be remarkably general — it applies to midlatitude jet streams in observations, in climate models, in idealized numerical models, and over a range of time scales from daily to decadal.

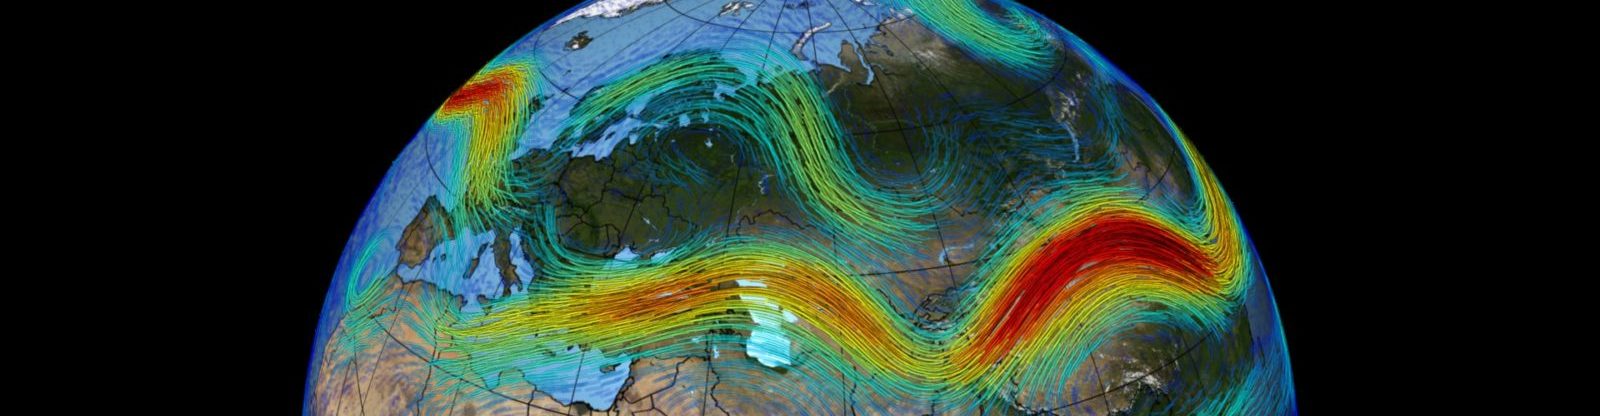
Observational jet analysis using the method of Spensberger et al. (2017) applied to the 2-PVU surface in ERA-Interim in winter (1979–2014). Each panel shows the frequency of identified jets from 6-hourly data partitioned according to the speed of the jet (m/s). Blue lines indicate the positions of the climatological jet axes. Adapted from Figure 4 of Woollings et al. 2018.
The figure above shows wintertime jet streams at the tropopause, the surface separating the troposphere from the stratosphere. The shading indicates how often a jet is detected, and each panel groups these jet frequencies according to the speed of the detected jets (the speeds in m/s are indicated at the top left of each panel). Weaker jets are seen to occur over a wide range of latitudes. As the jet speed increases, the possible jet locations contract around the climatological jet axes, shown in blue.
An underlying barotropic mechanism is proposed to explain this behavior, related to the change in refractive properties of a jet as it strengthens, and the subsequent effect on the distribution of Rossby wave breaking. Read more about this work at the links below.
Spensberger, C., T. Spengler and C. Li, Upper tropospheric jet axis detection and application to the boreal winter 2013/14, Mon. Wea. Rev., 145, 2363–2374, 2017. link
Woollings, T., E.A. Barnes, B. Hoskins, Y.-O. Kwon, R. Lee, C. Li, E. Madonna, M. McGraw, T. Parker, R. Rodrigues, C. Spensberger and K. Williams, Daily to decadal modulation of jet variability, J. Climate, 31, 1297-1314, 2018. link