Category Archives: Teaching material

Split jet stream brings cold, clear winter days to Scandinavia

A new study by jetSTREAM postdoctoral researcher Erica Madonna finds that a weather pattern known as European-Scandinavian blocking tends to occur when the North Atlantic jet stream is in a “split” configuration.

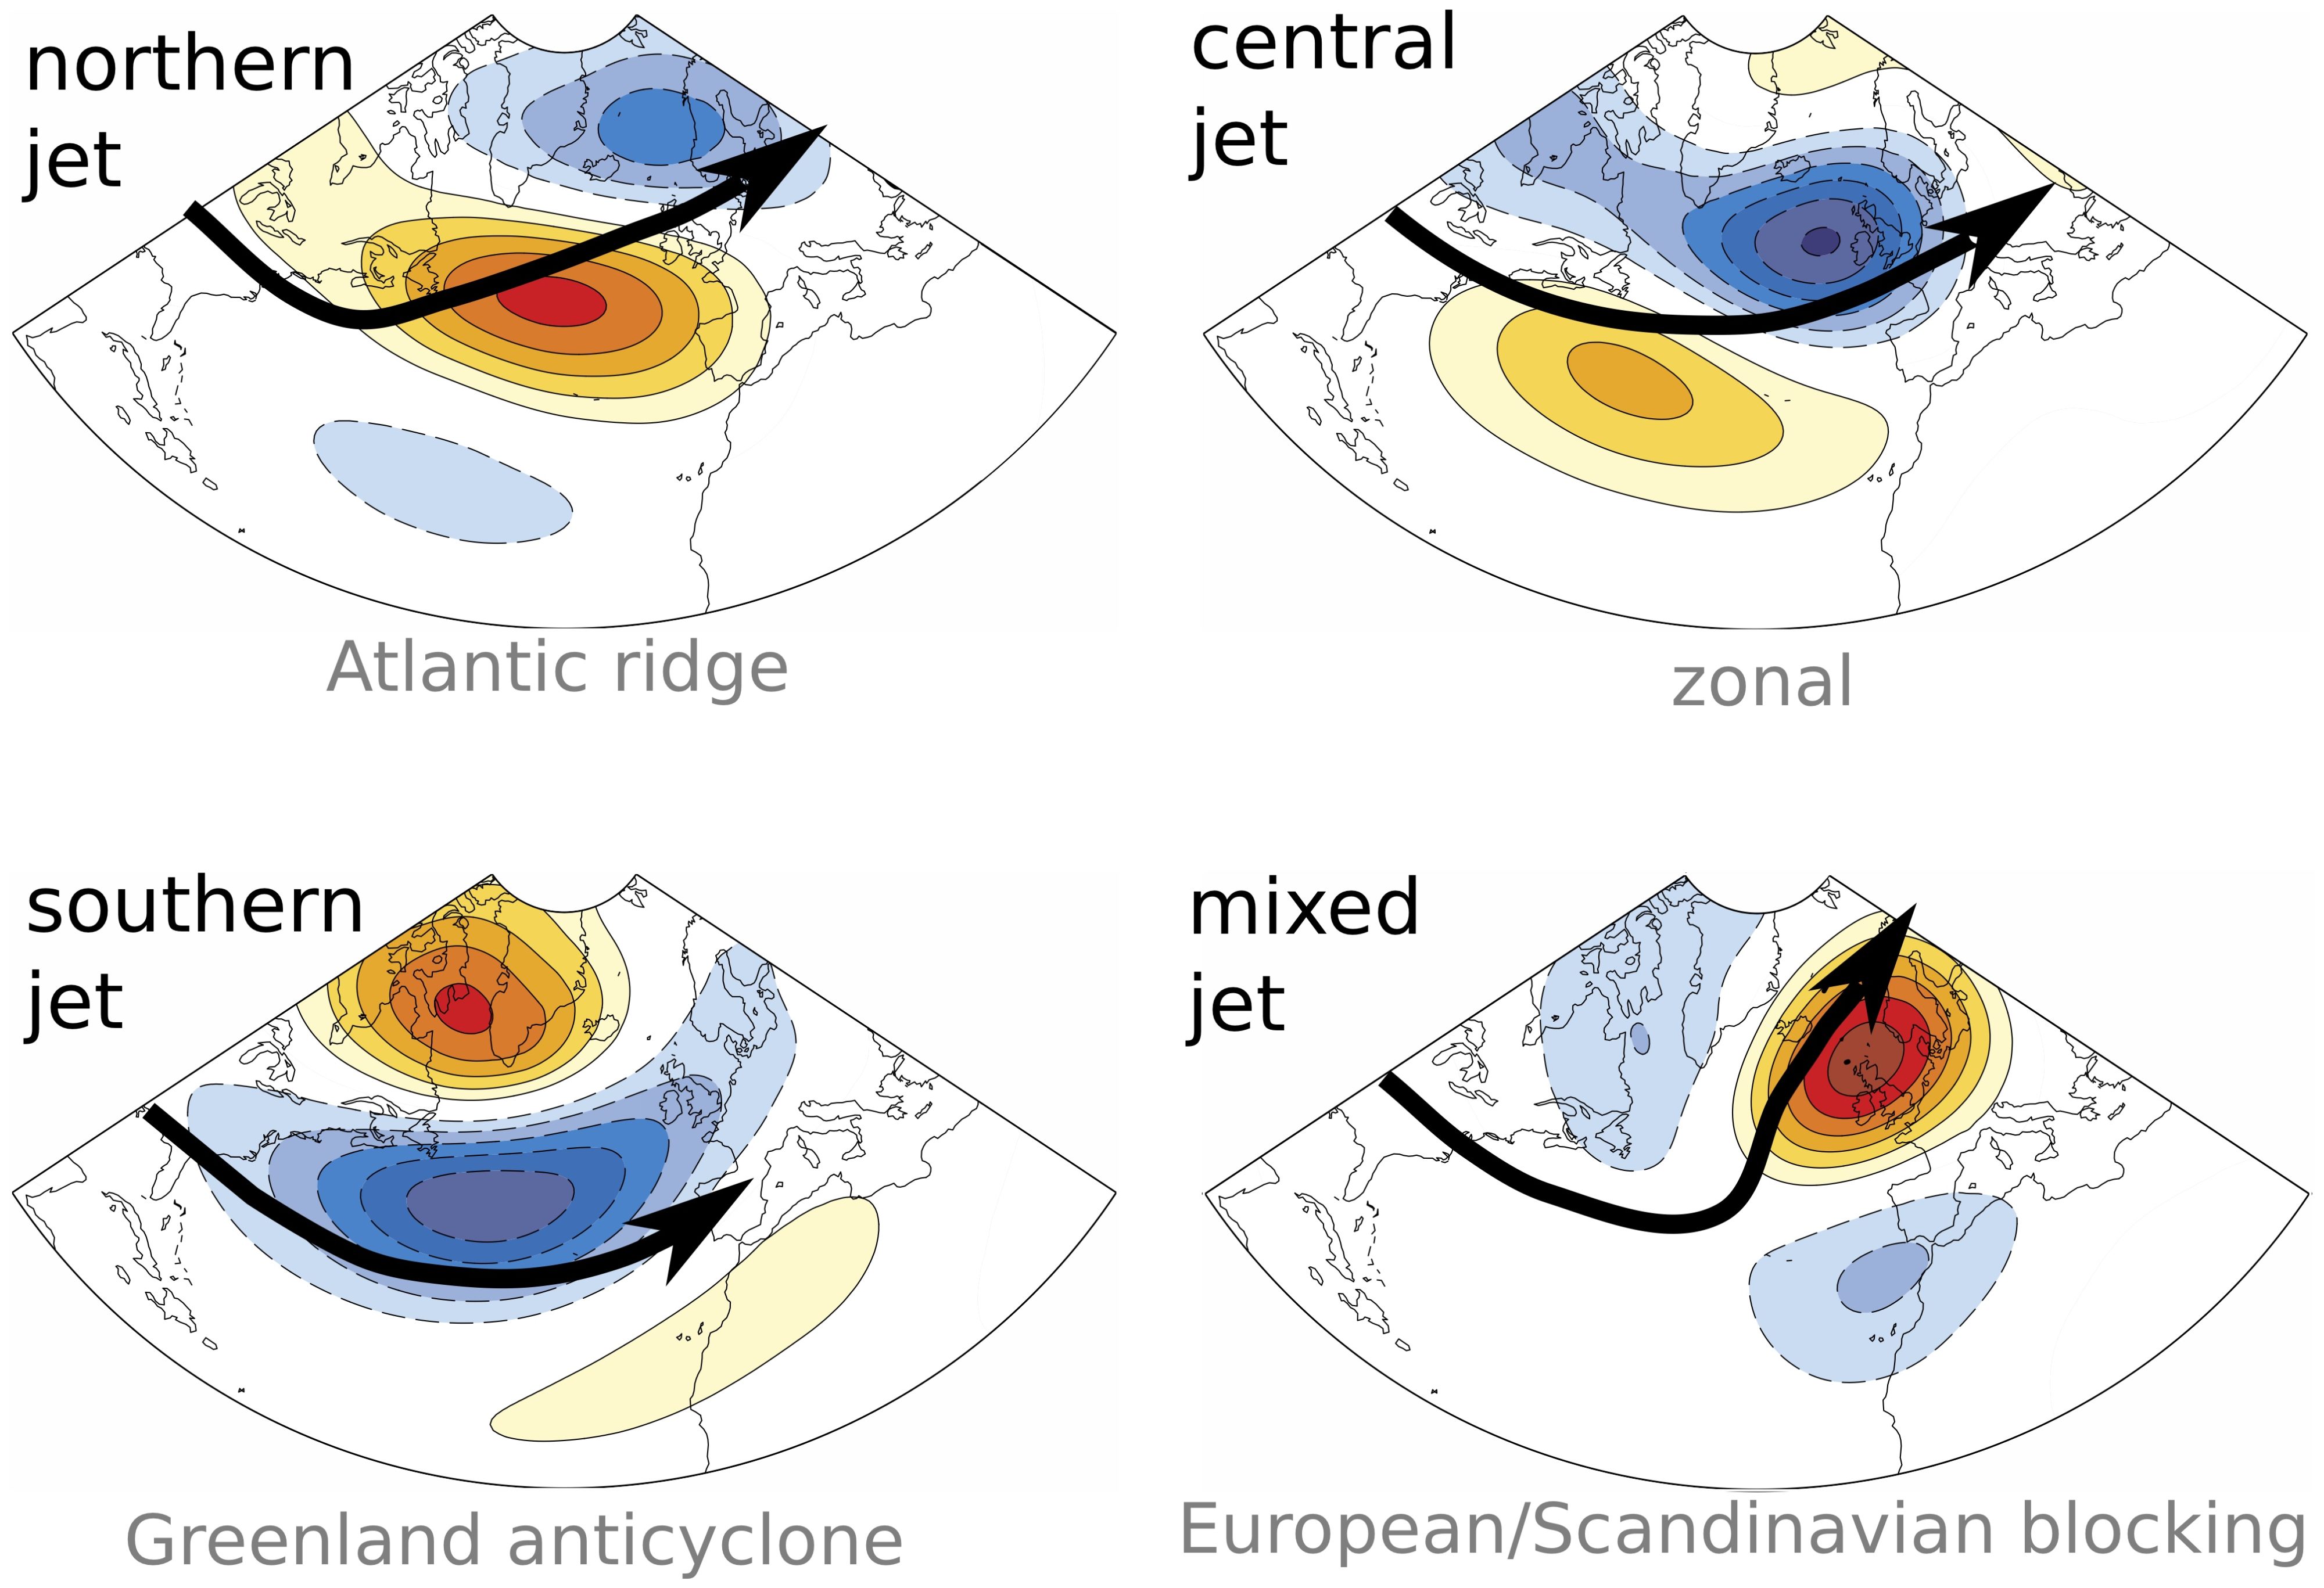
Schematic of four typical configurations of the North Atlantic jet stream (black arrow) and their associated pressure patterns (colour shading). Red indicates anticylonic pressure anomalies (also known as highs or ridges), where winds circulate clockwise; these are a signature of blocking events.

Previous studies identified connections between other types of blocking and the North Atlantic jet: blocking over Greenland with southern jets, blocking/ridge anomalies off the Iberian peninsula with northern jets, and unblocked flow with central jets. However, European-Scandinavian blocking remained somewhat unclear. The cluster analysis used in this study was able to pick out an additional split jet structure, which is slightly more complicated, and tie it to blocking over the continent.

Read more about the work here or download the research article:
Madonna, E., C. Li, C. Grams and T. Woollings, The link between eddy-driven jet variability and weather regimes in the North Atlantic-European sector, QJRMS, 143, 2960-2972, 2017.

Visualizing the atmospheric circulation


Water transport in the atmosphere. Shown are the column atmospheric water content in white, evaporation in pink, and precipitation in blue. Data from ECMWF ERA-Interim reanalysis (September to November 2014). The running date is indicated at the bottom right. Credit: Mats Bentsen, Uni Research Climate.

This movie is a fantastic visualization of the atmospheric flow as it evolved over the autumn of 2014, revealing many fundamental features of the general circulation.

In the midlatitudes, sweeping weather systems travel eastwards, wrapping tendril-like fronts around their centres. The weather systems follow the jet streams, belts of strong winds blowing west to east, and are concentrated in regions known as “storm tracks” in the North Pacific, North Atlantic, and South Pacific Oceans. These systems bring precipitation, which becomes snow as autumn progresses into winter, blanketing the Eurasian continent by late October and North America by late November. Around the Great Lakes, “lake effect snow” can be seen when weather systems bring cold air masses across the warm lake surfaces from west to east, depositing snow on the eastern shores (watch this region around 1 November and 16 November, for example).

In the tropics, small-scale convective systems travel westwards at a rather modest speed. From mid-September until mid-October, a number of typhoons (tight, circular structures spinning counter-clockwise) can be seen racing westwards across the tropical Pacific. Most of them veer northwards towards Japan as they approach the Asian coast.

Atmospheric jet streams

Atmospheric jet streams are belts of strong westerly (west-to-east) winds circling the Earth. Associated with the jet streams are the storm tracks, preferred regions for the growth and propagation of midlatitude weather systems.

Northern Hemisphere jet streams during the winter season (December to February). Blue shading shows the upper level jet (250 hPa; contour intervals of 15 m/s). The arrows show the lower tropospheric jet (at 850 hPa; 5 m/s reference arrow in red).

Pictured above are the Northern Hemisphere jet streams during the winter season (December to February). Three main jets are observed: the North Atlantic jet, the African jet, and the North Pacific jet.

The shading shows the jet in the upper troposphere, about 10 km up from the surface. The westerly winds are strongest at these levels. The contour interval is 15 m/s, which means the North Pacific jet has an average wintertime speed of over 60 m/s (that’s more than 200 km/h!). The North Atlantic jet is about half that strength. Another difference is that the North Pacific jet is rather zonal (oriented mainly east-west), while the North Atlantic jet has a pronounced southwest-northeast tilt. Such differences are due to the placement of continents, large mountain chains such as the Rockies and Tibetan Plateau, and warm ocean currents on Earth.

The arrows show the jet in the lower troposphere, about 1.5 km above the surface of the Earth. Winds at this level generally match up with winds in the upper troposphere over the ocean basins, but there are some differences over land. Lower tropospheric winds over northern Eurasia are relatively strong compared to upper tropospheric winds. Conversely, the African jet does not exist at these lower levels.

Northern Hemisphere jet streams during the summer season (June to August). Blue shading shows the upper level jet (250 hPa; contour intervals of 15 m/s). The arrows show the lower tropospheric jet (at 850 hPa; 5 m/s reference arrow in red).

In summertime, winds are much weaker owing to weaker temperature gradients between the equator and pole. The main jet streams are still evident, but slower and shifted north relative to the winter jets. The strong lower tropospheric winds in the Indian Ocean are a signature of the monsoon.

Data used to create the plots shown here are from ECMWF’s ERA-Interim reanalysis for the period 1979 to 2015.