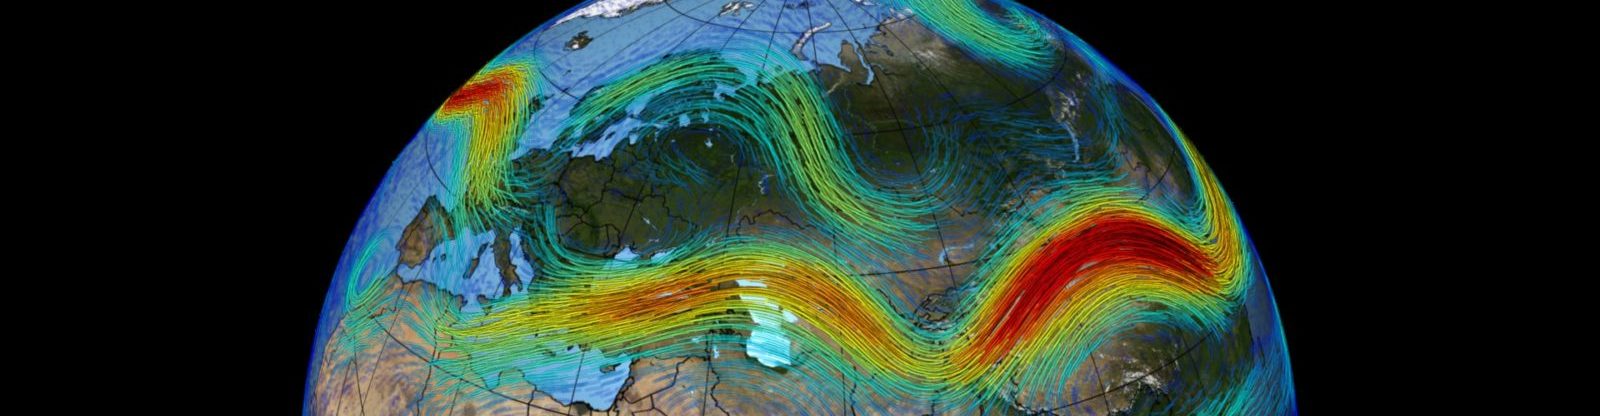
Water transport in the atmosphere. Shown are the column atmospheric water content in white, evaporation in pink, and precipitation in blue. Data from ECMWF ERA-Interim reanalysis (September to November 2014). The running date is indicated at the bottom right. Credit: Mats Bentsen, Uni Research Climate.
This movie is a fantastic visualization of the atmospheric flow as it evolved over the autumn of 2014, revealing many fundamental features of the general circulation.
In the midlatitudes, sweeping weather systems travel eastwards, wrapping tendril-like fronts around their centres. The weather systems follow the jet streams, belts of strong winds blowing west to east, and are concentrated in regions known as “storm tracks” in the North Pacific, North Atlantic, and South Pacific Oceans. These systems bring precipitation, which becomes snow as autumn progresses into winter, blanketing the Eurasian continent by late October and North America by late November. Around the Great Lakes, “lake effect snow” can be seen when weather systems bring cold air masses across the warm lake surfaces from west to east, depositing snow on the eastern shores (watch this region around 1 November and 16 November, for example).
In the tropics, small-scale convective systems travel westwards at a rather modest speed. From mid-September until mid-October, a number of typhoons (tight, circular structures spinning counter-clockwise) can be seen racing westwards across the tropical Pacific. Most of them veer northwards towards Japan as they approach the Asian coast.