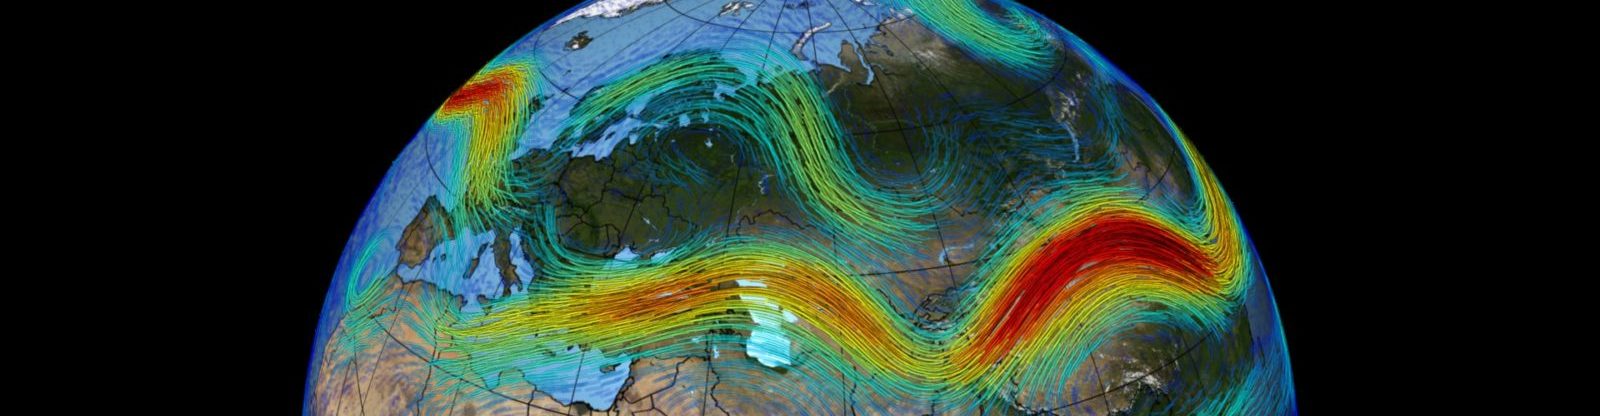
Atmospheric jet streams are belts of strong westerly (west-to-east) winds circling the Earth. Associated with the jet streams are the storm tracks, preferred regions for the growth and propagation of midlatitude weather systems.
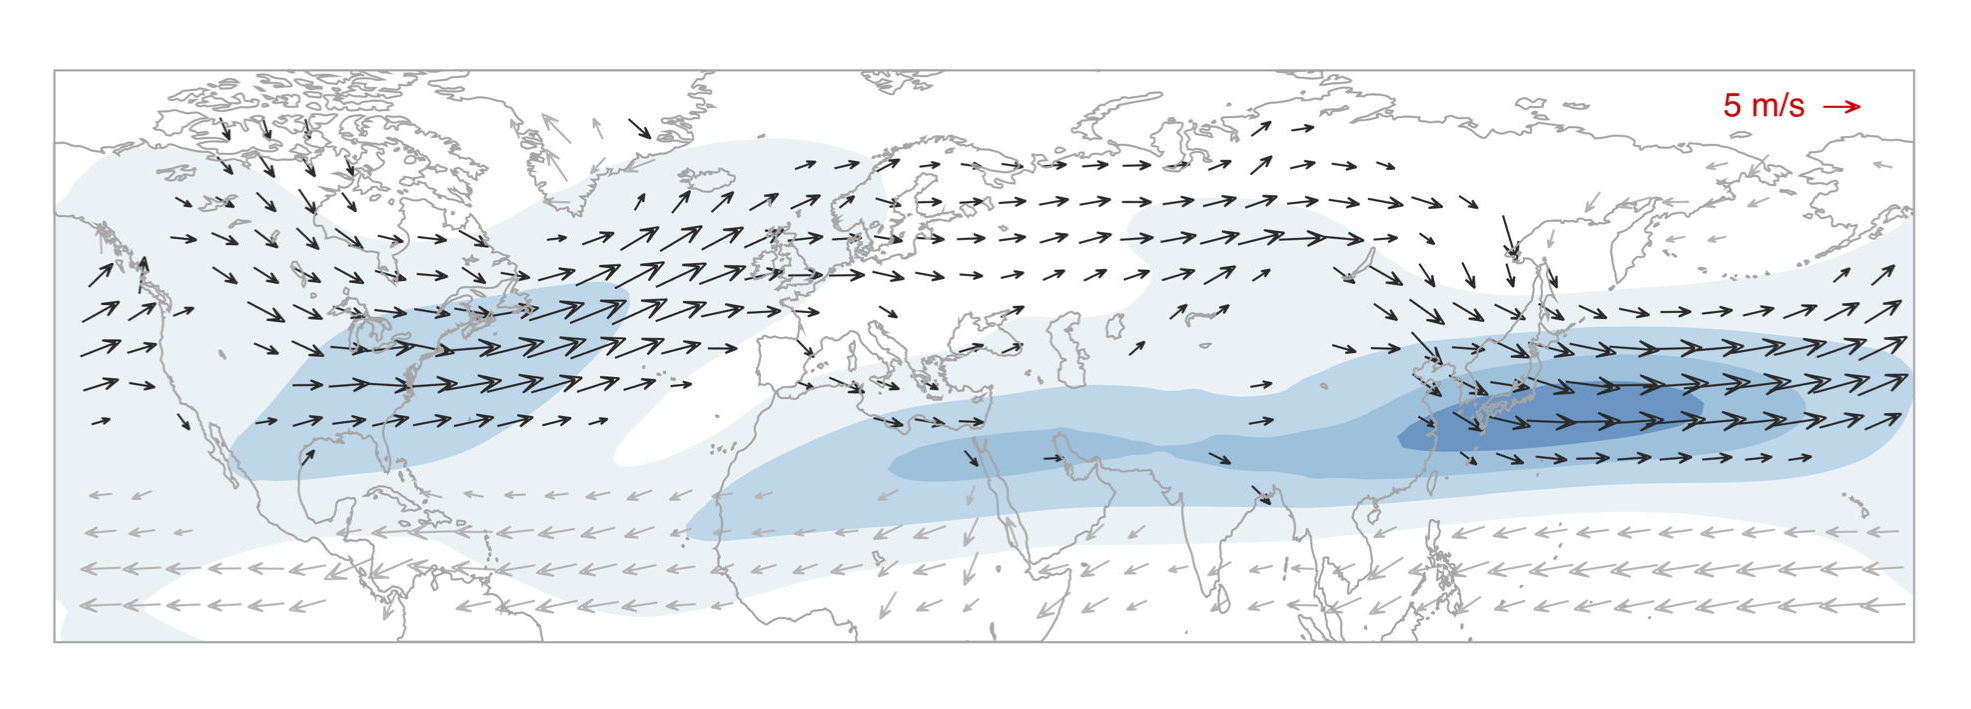
Northern Hemisphere jet streams during the winter season (December to February). Blue shading shows the upper level jet (250 hPa; contour intervals of 15 m/s). The arrows show the lower tropospheric jet (at 850 hPa; 5 m/s reference arrow in red).
Pictured above are the Northern Hemisphere jet streams during the winter season (December to February). Three main jets are observed: the North Atlantic jet, the African jet, and the North Pacific jet.
The shading shows the jet in the upper troposphere, about 10 km up from the surface. The westerly winds are strongest at these levels. The contour interval is 15 m/s, which means the North Pacific jet has an average wintertime speed of over 60 m/s (that’s more than 200 km/h!). The North Atlantic jet is about half that strength. Another difference is that the North Pacific jet is rather zonal (oriented mainly east-west), while the North Atlantic jet has a pronounced southwest-northeast tilt. Such differences are due to the placement of continents, large mountain chains such as the Rockies and Tibetan Plateau, and warm ocean currents on Earth.
The arrows show the jet in the lower troposphere, about 1.5 km above the surface of the Earth. Winds at this level generally match up with winds in the upper troposphere over the ocean basins, but there are some differences over land. Lower tropospheric winds over northern Eurasia are relatively strong compared to upper tropospheric winds. Conversely, the African jet does not exist at these lower levels.
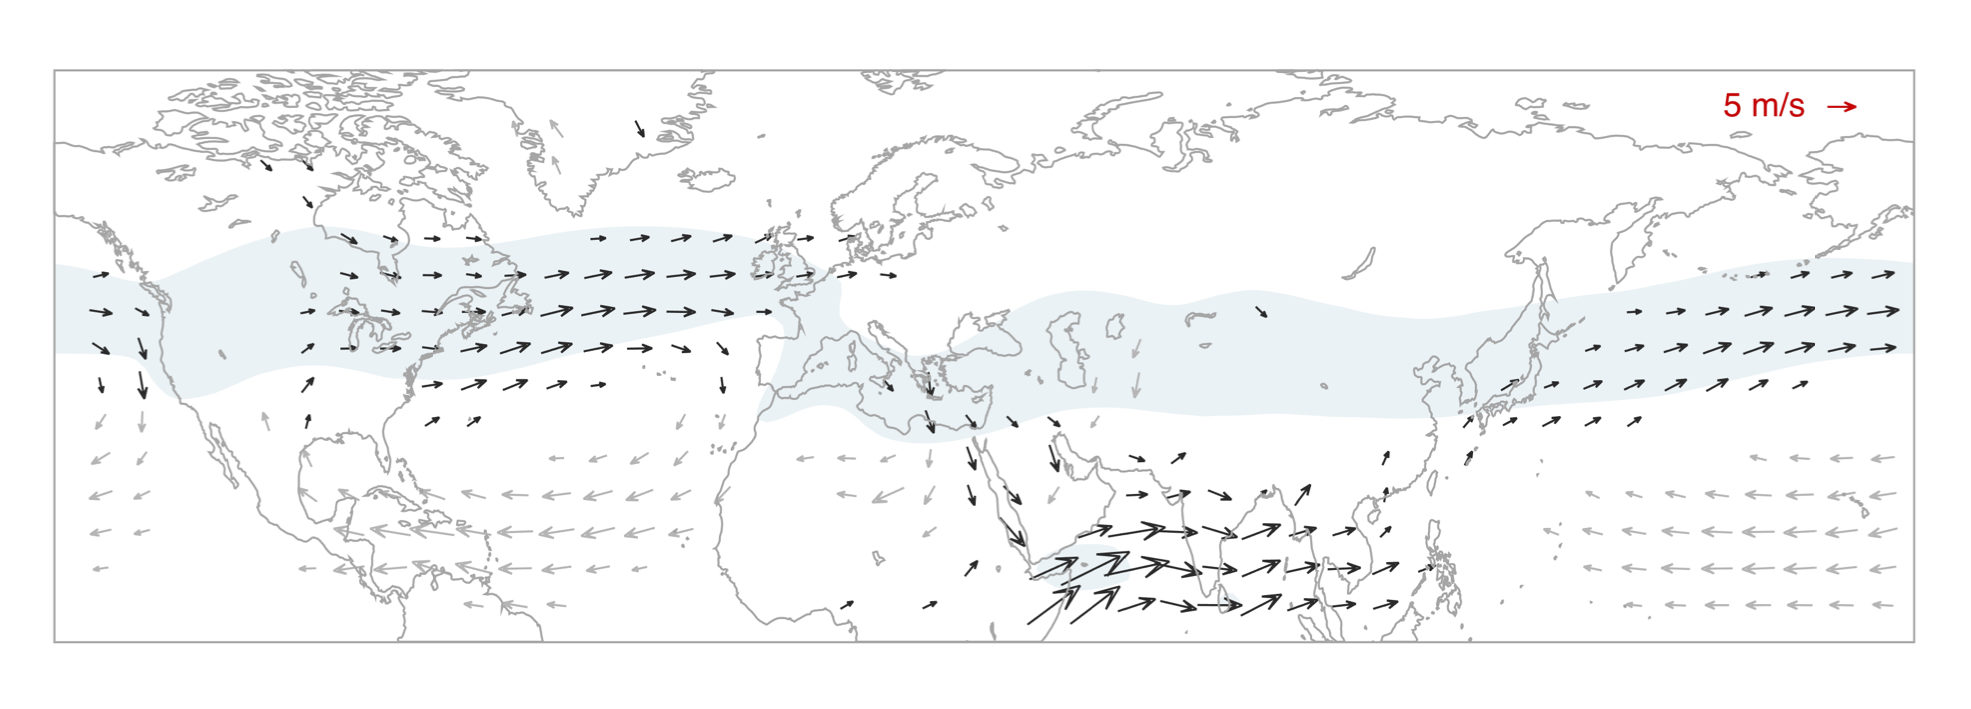
Northern Hemisphere jet streams during the summer season (June to August). Blue shading shows the upper level jet (250 hPa; contour intervals of 15 m/s). The arrows show the lower tropospheric jet (at 850 hPa; 5 m/s reference arrow in red).
In summertime, winds are much weaker owing to weaker temperature gradients between the equator and pole. The main jet streams are still evident, but slower and shifted north relative to the winter jets. The strong lower tropospheric winds in the Indian Ocean are a signature of the monsoon.
Data used to create the plots shown here are from ECMWF’s ERA-Interim reanalysis for the period 1979 to 2015.